Bone Scans Explained (and What Your Results Really Mean)
If you’ve ever tried to understand your bone scan results, you’ve probably run into the same problem many patients and even many clinicians face: the result may look simple, but the reality is not.
A report may say normal, osteopenia, or osteoporosis. It may show a T-score, a Z-score, or a recommendation for follow-up. But behind that report is a more complicated truth: bone health is not defined by one number alone. Bone strength depends on bone density, but also on bone quality, microarchitecture, turnover, geometry, and your unique health and medical status.
The conversation around bone density tests, osteoporosis screening, and fracture risk assessment has evolved to include a more comprehensive understanding of bone health. DXA remains the clinical standard and the backbone of an osteopenia or osteoporosis diagnosis. But other tools - including trabecular bone score (TBS), QCT, REMS, and bone turnover markers - can add critical information that DXA alone cannot provide.² ³
For patients, that means a bone scan result should be understood as a piece of the puzzle, not the entire story. For clinicians,, it means the best diagnostic strategy is increasingly about choosing the right test for the right patient rather than relying reflexively on one modality.
Bone density is important. But bone quality matters too.
One of the most important concepts in modern bone health is the distinction between bone density and bone quality. Bone density refers to the amount of mineralized bone measured by imaging. Bone quality is broader. It includes bone structure, cortical thickness and porosity, mineralization, collagen properties, accumulated microdamage, and remodeling dynamics.¹
This distinction helps explain something patients often find confusing: why one person fractures with only mildly low bone density while another does not fracture despite a similar T-score. It also explains why fracture risk assessment should never rely on bone mineral density (BMD) alone. A patient’s age, fracture history, medication exposure, diabetes, falls risk, spinal degeneration, and other clinical factors can all change the interpretation of a bone scan results..¹ ³
In practical terms, density tells you how much bone exists. Quality helps tell you how well that bone resists fracture.¹
DXA is still the standard, however it has important limitations
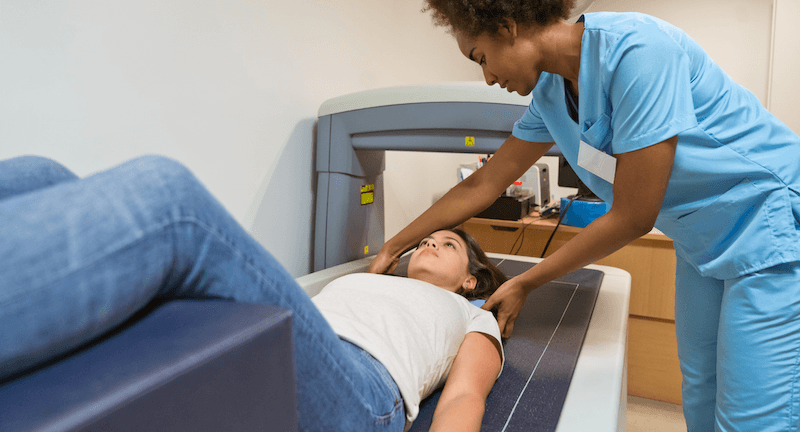
When most people search for a bone density scan, they are talking about DXA or DEXA. It’s long been the primary diagnostic scan for low bone density, and most women over 60 have had one, or at least been told they should have one.
Central DXA remains the most widely used and guideline-supported test for diagnosing osteoporosis in postmenopausal women and in men age 50 and older. The International Society for Clinical Densitometry (ISCD) states that osteoporosis may be diagnosed when the T-score is -2.5 or lower at the lumbar spine, total hip, or femoral neck, and in some situations the 33% radius (1/3 radius) may also be used.²
There is a good reason DXA became the standard. It is fast, relatively low radiation, widely available, and closely tied to clinical decision-making, treatment thresholds, and long-term monitoring.² ⁴
But DXA is often misunderstood. It does not measure true volumetric bone density. It measures areal BMD, a two-dimensional estimate reported in grams per square centimeter. That means it is taking a 2D measurement of a 3D structure.¹ ⁵
This matters because bone size affects DXA results. Smaller bones can appear less dense, and larger bones can appear more dense, even when their true volumetric density is similar.
In other words, DXA can make a small-boned person look more osteoporotic than they truly are, and it can make a larger-boned person look more protected than they really are.⁵ ⁶
This limitation is especially relevant when the forearm is measured. ISCD recommends forearm BMD primarily when the hip or spine cannot be measured or interpreted, in hyperparathyroidism, or when a patient exceeds the weight limit of the DXA table.²
That caution is important. Because forearm DXA is still based on areal density, it can be especially vulnerable to bone-size effects. In a smaller-framed patient, the forearm may look disproportionately low. In a larger-framed patient, it may look somewhat more reassuring than the true skeletal picture warrants.² ⁵
DXA also has another major weakness: it can be falsely reassuring, particularly at the spine. Degenerative change, osteoarthritis, osteophytes, scoliosis, sclerosis, vascular calcification, and prior surgery can all spuriously elevate lumbar spine BMD measurements. That is one reason an older patient may have a spine result that looks better than expected even when fracture risk is clearly elevated.⁴ ⁷
So the strengths of DXA are real. It is standardized, accessible, low-radiation, and deeply integrated into osteoporosis care.
But the limitations are just as real! And it’s important for you, the patient, to understand the strengths and limitations when working with your doctor on a treatment plan.
What T-scores and Z-scores actually mean
For many patients, the most visible part of a bone density report is the T-score. This compares bone density with that of a healthy young adult reference population. In postmenopausal women and men age 50 and older, it is the number used for standard diagnostic classification.
Broadly speaking, a T-score of -1.0 or above is considered normal, between -1.0 and -2.4 reflects low bone mass or osteopenia, and -2.5 or lower is consistent with osteoporosis.² ⁸
The Z-score is different. It compares bone density with that of people of similar age and sex. It is mostly used in premenopausal women, men under 50, and younger adults, where T-score-based WHO diagnostic categories are not meant to be applied in the same way.²
This is one of the reasons you should not read a bone report and make instant assumptions about what it means for your risk. A low score matters, but the site measured, the type of score used, and the quality of the scan itself all affect interpretation.
Trabecular bone score helps clarify bone density versus bone quality
One of the most useful ways to improve the information from a DXA scan is with trabecular bone score, or TBS. TBS is not a separate scan in the usual sense. It is a software-based analysis of the lumbar spine DXA image that evaluates gray-level texture and serves as an indirect marker of trabecular microarchitecture.² ⁹
That matters because DXA gives a density estimate, but not a direct window into internal bone texture and organization. TBS helps fill in some of that missing information. Updated evidence reviewed by ISCD and related experts has found that TBS improves fracture risk prediction in both primary and secondary osteoporosis and is most likely to change management in adults age 40 and older who are close to a treatment threshold by FRAX.³ ⁹
The most useful plain-language explanation is this: DXA tells you about the amount of bone, while TBS helps hint at the quality of the bone’s internal scaffolding.
TBS is not a replacement for DXA. But under the right circumstances, it can help explain why fracture risk seems higher than the T-score alone would suggest.² ³
QCT can be especially helpful when DXA is misleading
Quantitative computed tomography, or QCT, plays a different role. It is not the routine first-line screening test for most patients, but it can be very useful when DXA may be distorted by anatomy or artifact. QCT provides volumetric BMD, meaning it assesses density in three dimensions rather than as a projected 2D estimate.⁴ ¹⁰
QCT is particularly helpful in patients with advanced degenerative spine disease, scoliosis, or other conditions that may spuriously elevate spine DXA values. The American College of Radiology notes that in patients with advanced degenerative changes or other conditions that may falsely elevate BMD, both DXA and QCT can be appropriate, and QCT can be particularly useful in clarifying the picture.⁴
QCT also has the advantage of being more sensitive to trabecular bone loss and less susceptible than DXA to some of the degenerative changes and aortic calcifications that can falsely elevate lumbar spine measurements.¹⁰
At Osteoboost, we used QCT scans in our gold-standard clinical trial to ensure we had the best and most accurate patient data at both the beginning and the end of the trial. We knew that changes in bone density and bone strength measurement had to be precise, given the high bar for scientific proof and validation.
So what’s the catch? Why isn’t QCT always the first-line diagnostic scan?
QCT exposes you to more radiation than DXA. So for a high risk patient with unclear DXA results, the QCT is a great backup option.
REMS is one of the most promising newer tools in bone health
Among the newer bone technologies, REMS - Radiofrequency Echographic Multispectrometry - has drawn increasing attention. Our friend Dr. David Karpf at Stanford recently talked about the potential for REMS in our Bone Health AMA webinar last December.
REMS is an ultrasound-based scan that analyzes raw radiofrequency signals at the lumbar spine and femoral neck, rather than only peripheral sites like the heel.¹¹
The most obvious advantage is that REMS uses no ionizing radiation. That makes it highly safe for patients, and especially attractive for repeated assessments and for situations where minimizing radiation exposure matters. REMS machines are also portable and have shown encouraging agreement with DXA in multiple validation studies.¹¹ ¹²
At the same time, REMS should not be described as though it has already replaced DXA in mainstream practice. It hasn’t. Most formal diagnostic frameworks still revolve around DXA scans.² ¹¹
The evidence on REMS is encouraging but nuanced. A 2024 consensus review reported strong early diagnostic performance in an Italian multicenter study, with sensitivity around 91.5% at the femoral neck and 91.7% at the lumbar spine for discriminating DXA-defined osteoporosis, though the same review also emphasized quality exclusions and the need for good acquisition technique.¹²
More recent pooled evidence suggests REMS performs broadly similarly to DXA in some settings, but not identically, and that discordance can occur depending on patient group and exam quality.¹¹
This is where the pros and cons of REMS become especially important. On the pro side, REMS is radiation-free, examines central skeletal sites, and may provide information related not just to density but also to fragility features through tools such as the Fragility Score. It may also be useful in settings where DXA access is limited.¹¹ ¹²
On the con side, REMS is still more dependent on acquisition quality and operator technique than many clinicians assume. In layperson’s terms, REMS relies heavily on a well-trained technician and experienced scan reviewer to be accurate.
Some assessments have raised concerns about unsuccessful or suboptimal scans, especially in heavier patients, and about the fact that REMS is more limited in anatomical coverage than standard DXA workflows. It focuses primarily on L1-L4 and femoral neck, rather than offering the same standard total hip measurement widely used in DXA follow-up. Plus it does not fill the same role as forearm DXA in conditions where radius assessment matters.¹¹ ¹³
So REMS is best understood as a serious and promising tool - not a gimmick, not a miracle replacement, and not yet the universal standard. In the right hands and the right setting, it can add real value. But it still needs to be interpreted within the broader clinical picture.
Bone turnover markers add biology, not density
Another area of opportunity (and patient confusion) in osteoporosis care is the role of bone turnover markers. These are not imaging tests, and they do not diagnose osteoporosis on their own. Instead, they reflect the rate at which bone is being broken down and rebuilt.¹⁴ ¹⁵
The two most widely recognized reference markers are PINP, a marker of bone formation, and CTX (often beta-CTX), a marker of bone resorption. Recent consensus statements continue to support serum or plasma PINP and beta-CTX-I as the reference bone turnover markers in osteoporosis management.¹⁴ ¹⁵
This is another area Stanford endocrinologist, Dr. David Karpf, covered in our Bone Health AMA webinar. He uses bone turnover markers to understand if a patient’s low bone density is due to slowing bone formation, or increasing bone resorption. He can then use those results to select the best medications for patients.
These markers are also useful for monitoring treatment response and adherence. The lab results can change faster than bone density measurements on a scan, so a clinician may be able to see biologic evidence that therapy is working long before a repeat DXA shows a measurable change in BMD.¹⁴
The drawback is variability. Turnover markers can be influenced by sample timing, fasting status, renal function, assay differences, and pre-analytic handling. So they are best read as trends rather than as stand-alone answers.¹⁴
The simplest way to think about them is this: a bone turnover marker does not tell you how much bone you have. It tells you something about how active the remodeling process is right now.
How you can make sense of a bone scan report
When you receive your DXA scan result, ask not just "what's my T score" but now add "what kind of number is this and what might be affecting it"?
Even if your scan only shows modest osteopenia on DXA, you may still be at high risk of fracture if TBS is degraded or if you have a history of fractures. Even if you have a reassuring spine BMD, you may still have fragile bones if degenerative change is falsely elevating the DXA result. And a small-framed patient with a low forearm score may end up with a false diagnosis of osteoporosis and started on medications before they are needed.² ⁵ ⁷
That is why bone testing should be read as a part of a story you and your physician read together, not just a number.
The bottom line
The biggest mistake in bone health care is not choosing the wrong bone scan machine. Instead, it is assuming that one test or one score can give you the complete picture of your bone health.
DXA remains the clinical standard because it is commonly available, validated, and widely understood. But it measures areal rather than volumetric density, is influenced by body and bone size, and can be distorted by degenerative change.² ⁴ ⁵ ⁷
TBS adds texture and microarchitecture-related insight to DXA.
QCT is helpful when greater accuracy and granularity can help in clinical study or when spinal degeneration makes DXA less trustworthy.
REMS offers a radiation-free and increasingly evidence-backed alternative, with real promise. But it is also impacted by important limitations with technician and reviewer expertise as it becomes more commonly available.
And bone turnover markers help clinicians understand bone biology and monitor treatment, even though they are not diagnostic on their own.³ ⁴ ⁹ ¹¹ ¹² ¹³ ¹⁴ ¹⁵
For clinicians, the lesson is to match the tool to the question. What are you trying to solve? Are you looking to establish a baseline for your patients, resolve post-scan questions, or determine the best treatment plan which may include medications and/or Osteoboost?
For patients, the lesson is equally important: a bone scan result matters, but what matters even more is how that result is interpreted in the context of your whole risk picture.
And what matters most is that you have the answers to start building strength from within!
References
1. Docaj A, Wilson H, Evans M. Bone health: Quality versus quantity. 2024. Linked source: PMC article - https://pmc.ncbi.nlm.nih.gov/articles/PMC12088120/
2. International Society for Clinical Densitometry. Official Adult Positions (2023). Linked source: ISCD - https://iscd.org/official-positions-2023/
3. Goel H, et al. Clinical Use of Trabecular Bone Score: The 2023 ISCD Official Positions. 2024. Linked source: PubMed - https://pubmed.ncbi.nlm.nih.gov/38228014/
4. American College of Radiology. ACR Appropriateness Criteria: Osteoporosis and Bone Mineral Density. Linked source: ACR - https://acsearch.acr.org/docs/69358/narrative/
5. Golding PH, et al. Dual-energy X-ray absorptiometry (DXA) to measure bone mineral density: effect of bone size on areal density. 2022. Linked source: PMC article - https://pmc.ncbi.nlm.nih.gov/articles/PMC9352459/
6. Choksi P, Jepsen KJ, Clines GA. The challenges of diagnosing osteoporosis and the limitations of currently available tools. 2018. Linked source: Springer - https://link.springer.com/article/10.1186/s40842-018-0062-7
7. Ward RJ, et al. ACR Appropriateness Criteria Osteoporosis and Bone Mineral Density. Linked source: Journal of the American College of Radiology - https://www.jacr.org/article/S1546-1440(17)30198-9/fulltext
8. RadiologyInfo. Bone Density Scan (DEXA or DXA). Linked source: https://www.radiologyinfo.org/en/info/acs-osteoporosis-and-bmd
9. Shevroja E, et al. Update on the clinical use of trabecular bone score (TBS) in the management of osteoporosis. 2023. Linked source: Springer - https://link.springer.com/article/10.1007/s00198-023-06817-4
10. Carlson BB, et al. Prevalence of osteoporosis and osteopenia diagnosed using quantitative computed tomography compared with dual-energy x-ray absorptiometry. 2020. Linked source: The Journal of Neurosurgery - https://thejns.org/focus/view/journals/neurosurg-focus/49/2/article-pE5.xml
11. Fuggle NR, et al. Radiofrequency echographic multispectrometry (REMS) in the management of osteoporosis: a 2024 review and consensus perspective. Linked source: PMC article - https://pmc.ncbi.nlm.nih.gov/articles/PMC11192661/
12. Fuggle NR, et al. What is REMS? ESCEO consensus paper / 2024 review PDF. Linked source: PDF - https://remssw.com/wp-content/uploads/2025/01/1.-WHAT-IS-REMS-Fuggle-et-al.-ESCEO-Consensus-Paper-ACER-2024pdf.pdf
13. Medical Services Advisory Committee. PICO Confirmation for Radiofrequency Echographic Multi Spectrometry (REMS). Linked source: https://www.msac.gov.au/sites/default/files/documents/1665%20Ratified%20PICO.pdf
14. Bhattoa HP, et al. Update on the role of bone turnover markers in the diagnosis and management of osteoporosis. 2025. Linked source: PubMed - https://pubmed.ncbi.nlm.nih.gov/40152990/
15. Osteoporosis Foundation / IOF-ESCEO-IFCC consensus summary. Joint consensus highlights the role of bone turnover markers in osteoporosis diagnosis and management. Linked source: https://www.osteoporosis.foundation/news/joint-consensus-highlights-role-bone-turnover-markers-osteoporosis-diagnosis-and-management